Crop Classification Using Satellite Imagery in the Orange River Valley, South Africa
Overview
The Orange River is a major agricultural region in South Africa that has been stricken by drought in recent years. Accurate data is needed to improve agricultural growth and manage for vulnerability in the face of global change. Sub-Saharan Africa in particular struggles with incomplete or unreliable data in the agricultural sector. In 2018, the international community organized to launch the 50 X 2030 initiative, a commitment to collect better farm data with the goal of ending hunger.
The goal of this project is to build a model that can identify a crop with satellite imagery which can help with monitoring more quickly and cheaply. I chose to focus on identifying vineyards because wine from Orange River is South Africa’s top exported agricultural product and is economically important to the region.
This project is a stepping stone to more advanced predictions such as crop yield prediction and predicted food security under future climate change scenarios.
Data
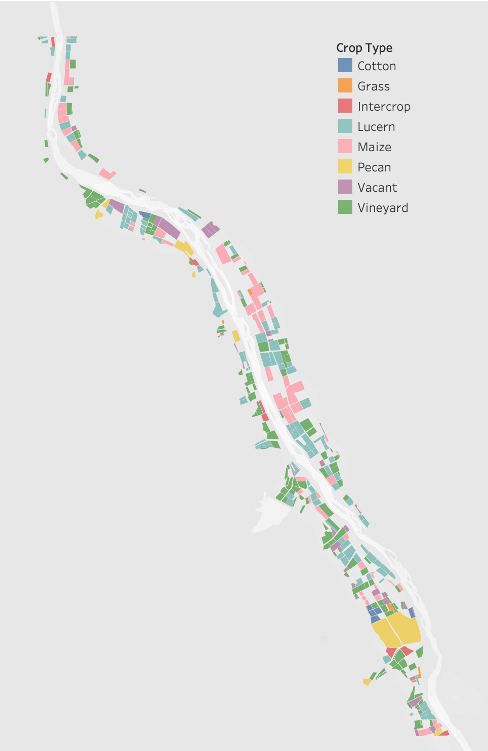
The crop dataset was provided as a polygon shapefile with 2,497 agricultural fields. The crops growing on each field were verified in person and with drones in 2017.
There are 7 crop types present in the fields:
- Cotton
- Dates
- Grass
- Lucern
- Maize
- Pecan
- Vacant
- Vineyard
- Vineyard & Pecan (“Intercrop”)
This is a subset of the crop data provided.
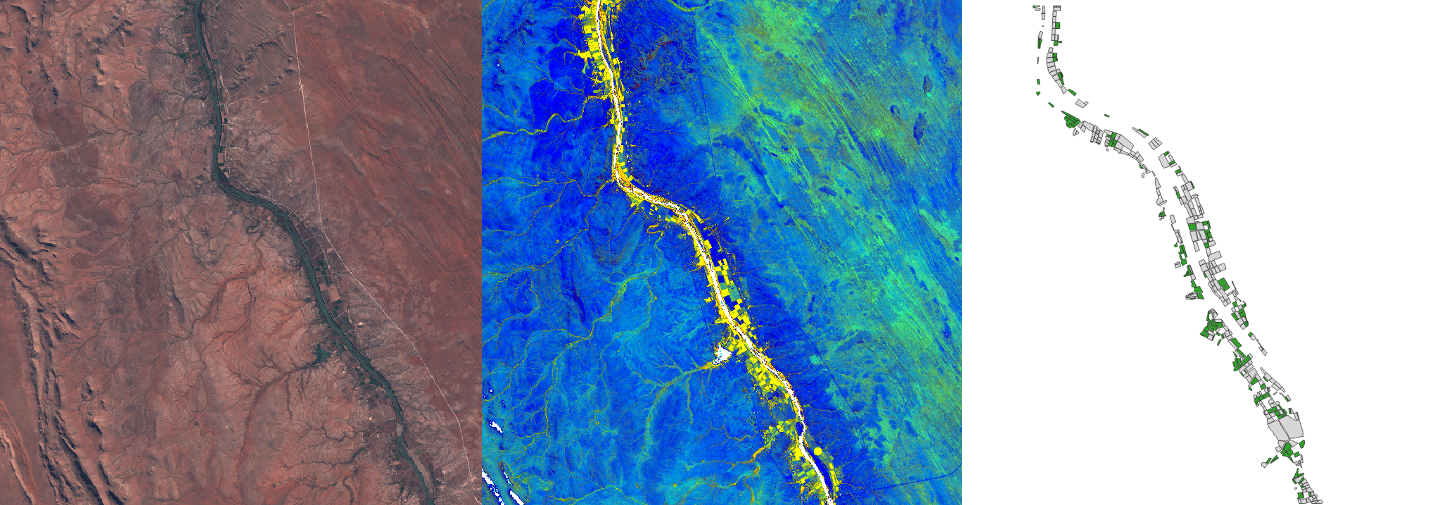
The satellite images from Sentinel-2 of the entire region across 11 time slices in one year (2017), covering summer and winter months. Sentinel-2 data has 13 bands.
Methods
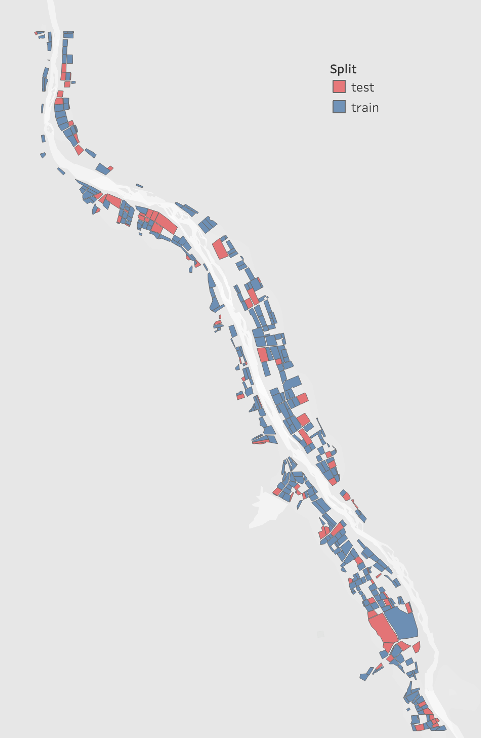
I used Sentinel-2 satellite imagery to train a model to estimate the probability that each field is either a vinyard or not a vinyard. After classifying all crops as either vinyard or not vinyard I split my training and testing data by field ID.
For my predictor variables I derived vegetation Indices from multispectral imagery from combination of visible and non-visible light. Indices highlight particular properties of vegetation like, nitrogen content, leaf water content, Moisture Stress.
I derived 6 different indices for each of the time slices and then calculated the mean and standard deviation across the year. So, I had 12 features in my final set of predictors - mean and standard deviation for each of the 6 indices.
Indices used:
- Green Normalized Difference Vegetation Index (gndvi)
- Moisture Stress Index (msi)
- Normalized Difference Infrared Index (ndii)
- Normalized Difference Vegetation Index (ndvi)
- Normalized difference red edge index (nrde)
- Chlorophyll Red-Edge (re)
Results
I Ran several models and the best performing one was Support Vector Classification, which makes sense because imagery is one thing that it is typically used for.
Important predictors tended to be the standard deviation of veg indices. This makes sense because it indicates the seasonality of a crop - whether a crop is a tree that is green for most of the year or a crop that is harvested during certain seasons.
I chose the f1-score to evaluate my model because I wanted a balance between precision and recall – they are both important in this case.
My final F1 score = .87
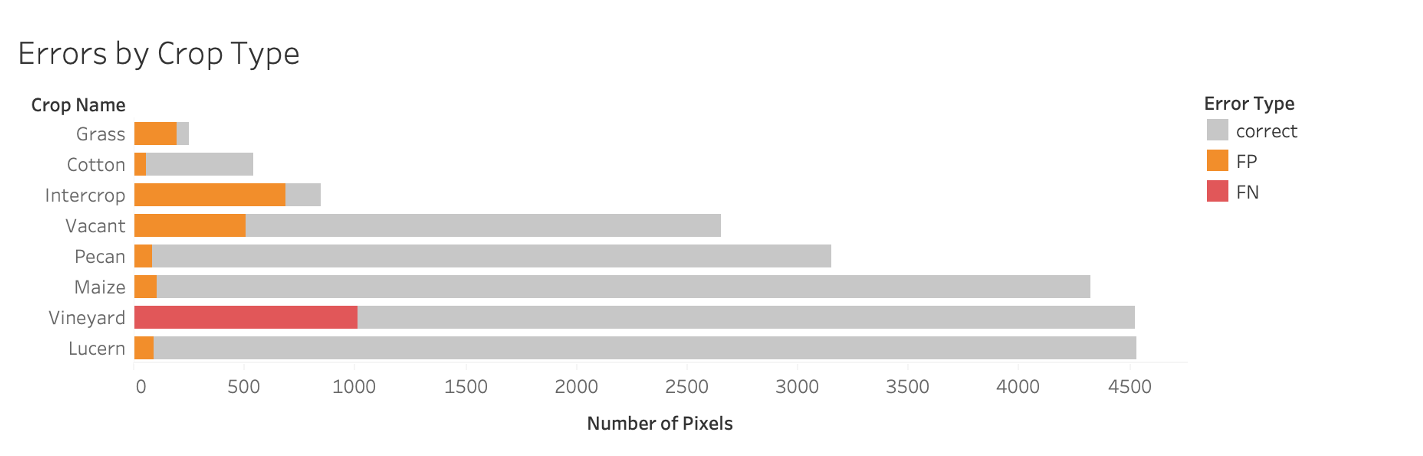
Errors
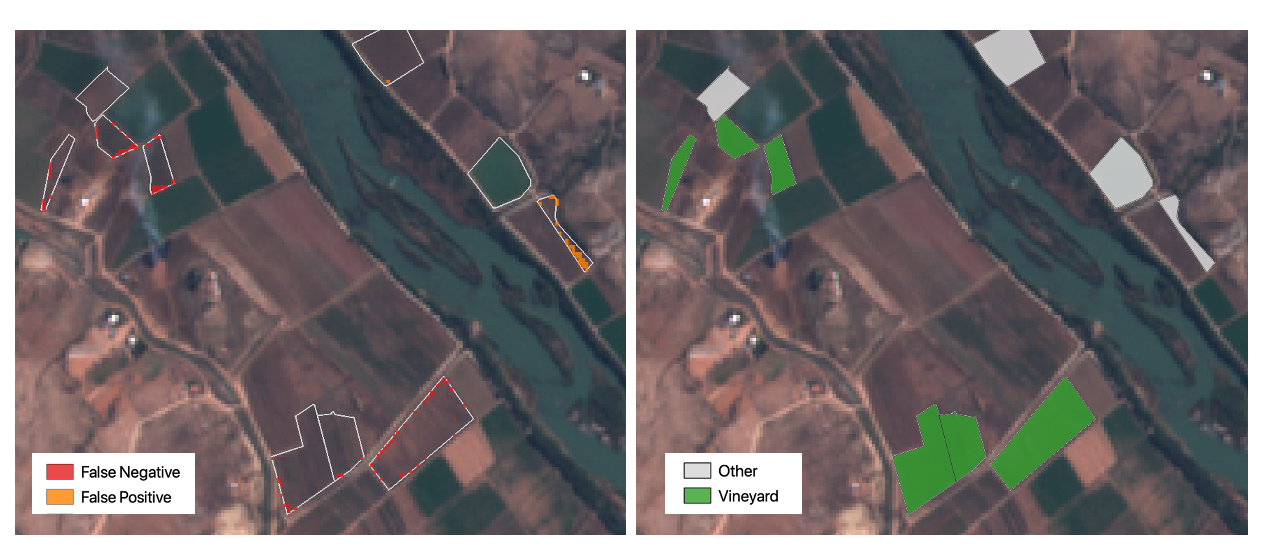
Because we’re dealing with geographic data we can map the errors. And most errors appeared at the edges of the fields. In the example shown below, there are enough pixels correctly classified that when we we aggregate the per pixel predictions to the polygon level the model correctly identifies the crop type for that field.
The highest number of false positives occur with the intercrop class which is mostly vineyard and pecan (based on the metadata). So, the model is probably correctly classifying vineyard pixels but the test set is at the polygon level and therefore classifying it as not vineyard.
We also generally se see poor performance in the minority classes. This is because there wasn’t enough samples for the model to learn how to distinguish between these crops and vineyards.